nach Wunsch auch mit Videocall
Working data driven. Everyone talks about it, but why are so few people doing it? Quite simply because there are big challenges to overcome on the way - both conceptually and technically as well as organizationally. Our mission at minubo is to meet these challenges for our customers at all levels. Learn more about why we've reached a milestone with this new feature - the Custom Insights Pages, in this blog post.
The 5 challenges on the way to a data-driven work culture
Basically, the following 5 key challenges have to be overcome on the way to your data-driven work culture:
- Concept: Which key figures are important and how are they calculated?
- Accessibility: How do I get the data I need?
- Convenience: How can I easily and quickly work with my data?
- Insightfulness: How do I generate relevant insights that actually help me with my tasks?
- Process: How do I integrate data-driven work into my daily work?
Points 1-2 are primarily questions of the basic BI / Analytics setup, which you as a minubo user can cross off the list immediately - the coverage of these basic requirements is part of our DNA.
Points 3-5 are primarily questions about the tools available. Here too, minubo users can cross off a large number of cases (we create tools that make all roles comfortable, relevant and process-oriented for data-driven work - that too is part of our DNA), but particularly for operational roles where, to this day, one challenge remains: How do I know where to start if I do not have a specific analytical question? Or another way: How do I find a meaningful start to my data-driven work day? This challenge is solved by our Custom Insights Pages.
A customized entry into your data-driven processes
The idea behind Custom Insights Pages: Report pages that provide a simple and meaningful view of what's happening in your own workspace, proactively highlighting key changes - with the disclosure of potential drivers for the changes you're viewing. From here, with seamless transition to further analysis, the causes of developments can be identified, and reinforcing measures or countermeasures can be derived.
The trick is that with just a few parameters, customized Insights Pages are created for every role in the company. Define your own individual page or exploit synergy effects by developing Insights Pages for specific role profiles, which are then rolled out to multiple users: creating an effective alignment of your teams, for example, to work together on given goals. In this way, by identifying best practices of data-driven work in certain functional roles, we are also able to help all users benefit from the lessons learned in the medium term.
Custom Insights for every role: That's how it works
So, let's take a look at how it works:
Define your roles
The first step is to define which roles in the company you want to design Insights Pages for. Important to know: minubo users are not limited to a single role or Insights Page - an SEA marketer, for example, could have both the ‘Marketing’ role with cross-channel marketing performance metrics and the ‘SEA’ role with specific metrics for his or her channel assigned to him or her. Perhaps there is also a "Team" role for all employees of the company - with holistic performance data? This could also be assigned to the SEA marketer as a third role.
Define your Key Measures and Support Measures
Our Insights Pages are each based on nine key figures: three Key Measures and six Support Measures. Key Measures form the basis for almost all elements of the Insights Pages: They are shown for the current week and how they have changed over the last ten weeks, broken down into a detailed report on the individual characteristics of your key attributes (see below) and they form the basis for alerting. Accordingly, the key measures should always correspond to your key figures or the key figures of the respective role. The Support Measures, on the other hand, are of secondary relevance - they only display in the weekly overview to provide supporting insights that help, for example, interpret the values of the key measures or enhance their cognitive value.
Define your Key Attribute
Your key attribute is the most relevant analysis perspective for you, or for a role. For example, if you are the Marketing Director, your key attribute could be: Marketing Channel. In the detail report, you can then see your Key Measures broken down into the individual marketing channels - and the alerts are calculated and displayed for your Key Measures, not just overall, but also per marketing channel.
Optionally define a filter for your data view
In addition to the definition of Key Measures, Support Measures and Key Attributes, you have the option of displaying the data of your Insights Pages in a specific filter view. For example, if you're responsible for the ‘Sneakers’ product category, you can set up your Insights Page to show you only the data in that category, which gives you a focused look at what's really important to you. (A matching Key Attribute in this example could be the product subcategory - giving you full visibility into your workspace.)
Already done: Discover your Custom Insights Page
Section 1: Alerts and Weekly Overview
Let's start with the most important insights: your alerts about significant changes in the range you define (Key Measures combined with Key Attributes) - calculated from the data of the last full week. Just below, you'll find the Weekly Overview: Your Key Measures and Support Measures, also calculated for the last full week and displayed in comparison to the previous year's value and the percentage change. By clicking on the measure name, you have the option to drill down into your individual Key and Support Measures. Useful: If you would like to continue working with the displayed data, you can convert it into a web pivot with one click and analyze it further with optimum flexibility.

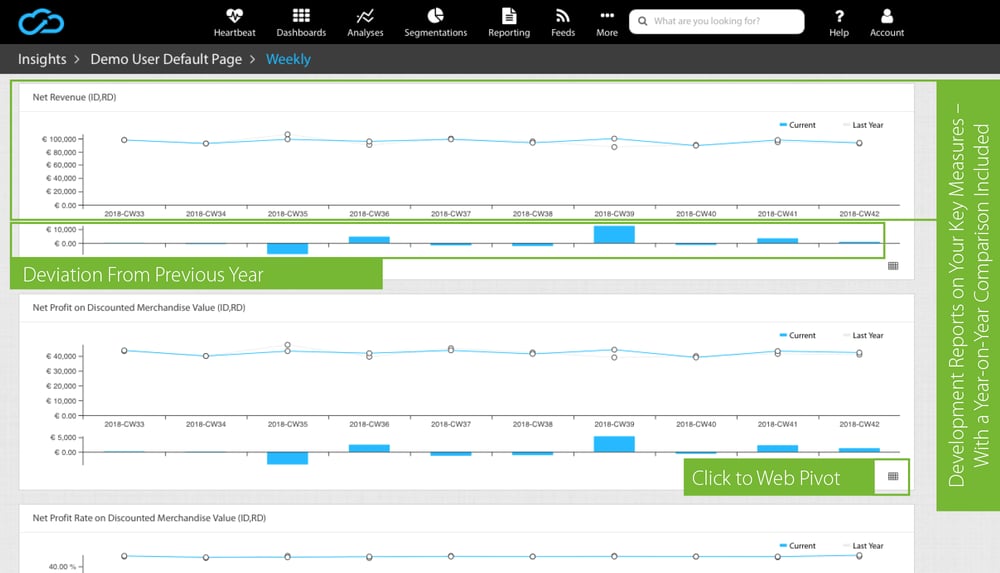
Section 2: Development Reports
The next section uses a line chart to show the evolution of your Key Measures over the last ten weeks, in direct comparison to the same period last year. To better emphasize abnormalities in the comparison of the periods, the deviation is shown separately in a supplementary bar chart - so you will not miss any important insights! Again, you can convert the report into a flexible web pivot for further analysis with just one click.
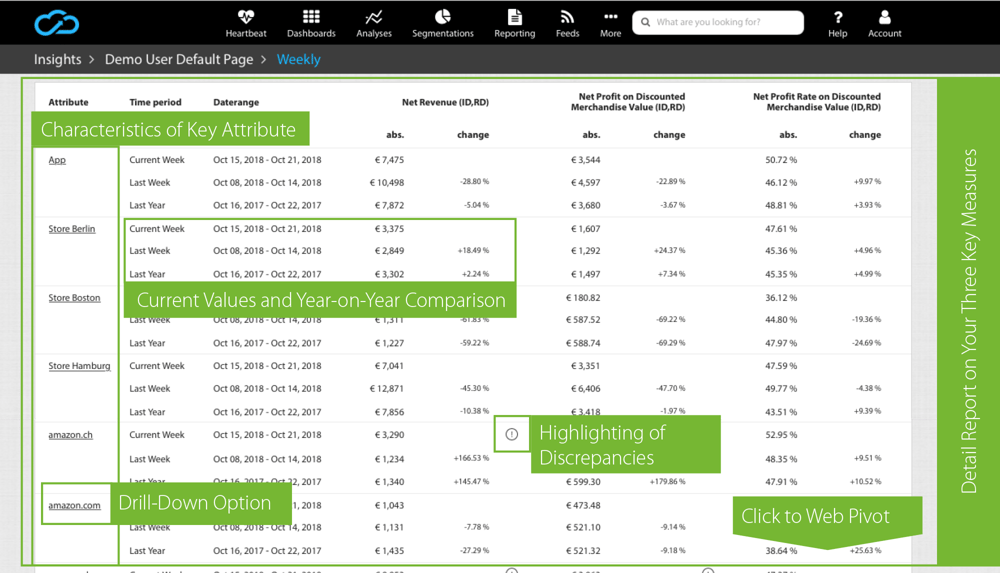
Section 3: Detail Report
The last section goes into great detail: Here you can find your three Key Measures broken down according to the characteristics of your key attribute - for the last full week and year-over-year comparisons. Discrepancies in the data are highlighted by an exclamation mark icon as in the alert section. Here you also have the option to open up a drill-down to the characteristics of your Key Attribute. (And: Of course, this report can also be converted to a web pivot with a click.)
Next steps for minubo users ...
If you are already a minubo user, the rest of the procedure is very simple:
- We recommend defining Insights Pages for all functional roles in your organization and rolling them out for all relevant employees: 3 Key Measures, 6 Support Measures, one Key Attribute, optionally a filter or a filter combination. To increase effectiveness and acceptance, it is best to develop the definitions with the team.
- As an alternative to defining on a blank sheet of paper, you can also create web pivots, which we then translate into your Insights Pages: the Key Attributes in the rows, Key and Support Measures in the values, the optional filter in the filter (where else).
- Contact your Key Account Manager to help you set up your Custom Insights Pages. He or she is also happy to advise and assist you in any way that you might need.
- If you want to create Insights Pages for a colleague without a minubo account, simply add him or her as a user through User Management or ask your Key Account Manager for help.
... and for those who want to become one
The first step to your Custom Insights Pages is in your minubo account - and it's not that hard to get! As a first step, arrange a meeting and we will set up a demo account for you:
- A data expert will guide you through a demo shop and show you applications tailored to your requirements
- See how you can create in-depth analyses, dashboards and reports with just a few clicks
- Get your free 14-day trial access and put minubo through its paces

E-Mail: contact@minubo.com
Telefon: 040-398 06 75-101