Whether at the managing director level or at the operational level: It is critical for the success of your company to always identify the most important developments to be able to act quickly on them. But how do you manage to get a quick overview of the latest numbers when there is such an abundance of data available and yet little time between meetings?
Overview Reports – The Essentials at a Glance
The increasing daily flood of business data requires good report management and communication. Company numbers must be transparent and accessible to employees as it is important to have a common understanding of the relevant key figures and KPIs.
While detailed reports are needed to understand individual developments and then act accordingly, it is equally important to have reports that give an overview of the most important facts and figures. The key points must be presented clearly on a highly aggregated level so that trends can be directly identified and understood by the team, as well as used to ensure that all interested parties have a common understanding. Therefore, such overviews not only serve the purpose to present numbers in a clear and understandable way, but also, to make them available to others.
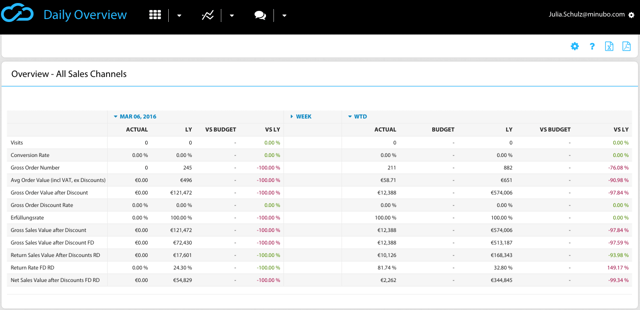
In conversation with our customers, it became clear (particularly in large companies in the fashion industry) that the best practice has proven valuable, which is to let employees create reports in the morning that are distributed to all – that’s how you guarantee transparency. The challenge for our customers in terms of fulfilling this task was primarily the time-consuming compilation and distribution of such reports. In order to resolve this problem, and in cooperation with our customers, we have hence developed the new minubo Overview Reports. In these reports, relevant company figures related to orders, sales and returns are provided, and they can be easily and quickly shared across the company.

A Common Conversation Template – On Time in Your Mailbox
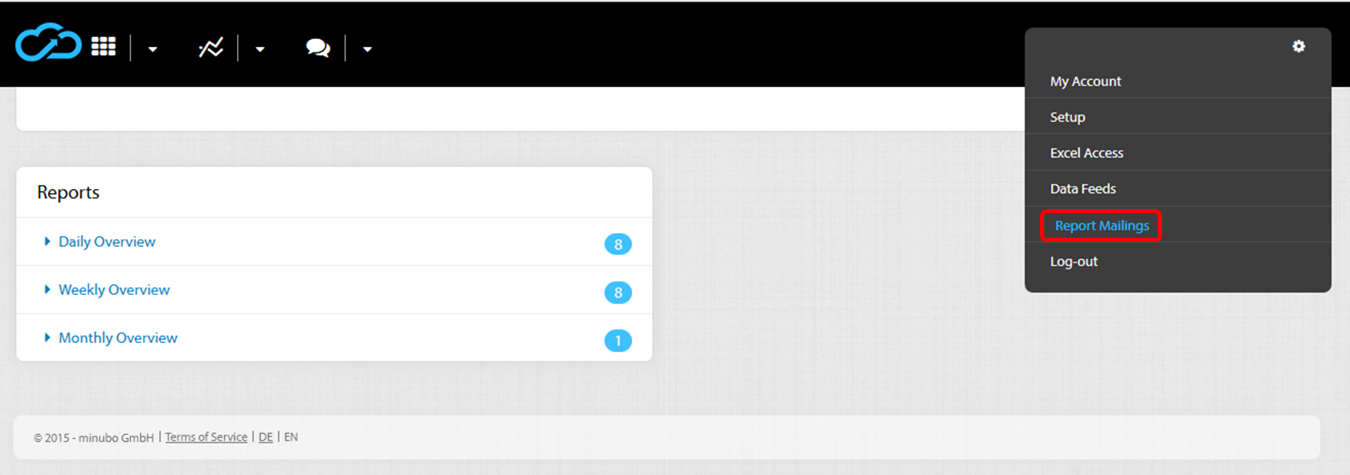
In order to access the Overview Reports, you don’t have to log in to the minubo application each time. Instead, you can simply subscribe to the reports as a newsletter and receive it when you want – either in Excel or PDF format – and we will send you the Overview Reports automatically. For you, this means you have the current figures on everyone’s desks – just in time for the team briefing on Monday. You only have to set up the subscription settings of your application once: You can select your desired recipients to simplify access to the information for your colleagues and create a common understanding of information, based on which, further steps can be initiated. That’s how minubo helps you to enable a data-driven decision-making culture to become a self-evident part of the work processes in your organization.

Variants of the Overview Reports
Depending on what bird’s eye view you want to take, there are three different options of the minubo Overview Reports available: Daily overviews, weekly overviews or monthly overviews. The reports show different time periods but use the same key data. This way the complexity is reduced without losing flexibility. You decide, depending on the target audience, how far the figures should go back – and so the reports are suitable for both strategy meetings with your manager, as well as for short Catch-Up meetings with your staff that are related to daily business operations. For a better decision-making culture on every level.
Register now for a demo and try it yourself!


 nach Wunsch auch mit Videocall