What is ‘revenue’ technically? This questions sounds banal, but it is not at all: In our experience, the same understanding of revenue is seldom shared by different departments. Instead, you often find as many different definitions of the word revenue as employees in a company.

The good news is: Most probably none of them are wrong. Nevertheless, the bad news is: with so many definitions you cannot achieve a company-wide comparability. Yet it is exactly that comparability that is necessary when working with data-driven figures and aiming for efficient and sufficient growth. Otherwise, you are not optimizing your profit, but your own reporting. And endlessly so.
Let’s try to put an end to that revenue jungle – and reveal the secret about different kinds of revenue and their definitions. It’s your basis to kickstart into a future of target-oriented optimization efforts!
The Revenue Funnel: gross order value, gross revenue, net revenue, net sales margin
There are two aspects that often stand in the way of a clear understanding of revenue:
- The prefixes ‘gross’ and ‘net’ do not relate to value added tax. They refer – according to minubo’s definition of revenue – to revenue before or after returns. All revenue key figures, generally speaking, display without value added tax.
- Revenues are subject to deductions (cancellations, returns, sales cost – and again and again discounts) that make a definition of different revenue key figures necessary. The term ‘revenue’ can therefore be specified in many different ways and it lacks, in its general form, significance.
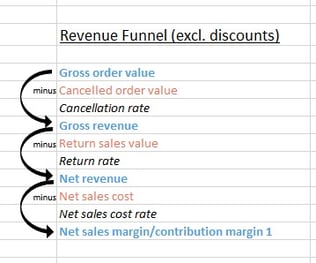
At minubo, we use the following definitions and terminology – types of positive revenue are marked in blue, types of expenses that cause profitability to sink are marked in red:
Gross order value: The gross order value includes the sum of all transacted orders – any deductions by cancellations, returns, sales costs or discounts are not yet taken into consideration.
Cancelled order value: The cancelled order value includes the sum of all order values related to cancelled orders.
Gross revenue: Contrary to gross order value, the gross revenue excludes all cancellations. In short: the gross revenue is the sum of all transacted orders (gross order value) less cancelled order value.
Return sales value: The return sales value is the sum of all gross order values of all returned goods.
Net revenue: Contrary to gross order value and to gross revenue, net revenue is adjusted by cancellations and returns. Meaning: net revenue is the sum of all orders (gross order value) minus cancelled order value and return sales value. In other words, the net revenue is the gross revenue less the return sales value.
Net sales cost: Net sales cost means the sum of all sales costs that arise because of sales (or that will arise), whose sales value is included in net revenue – sales cost for cancelled or returned goods are thus not included.
Net sales margin (contribution margin 1): Contrary to gross order value, to gross revenue and to net revenue, net sales margin is reduced by cancellations, returns and sales cost. In other words, net sales margin (or contribution margin 1) is the sum of all orders (gross order value) less cancelled order value, return sales value and net sales cost. Or: Net sales margin (contribution margin 1) means net revenue less net sales cost.
Marketing expenses: For calculating actual profits, not only do cancellations, returns and sales costs have to be deducted from revenue, but also, marketing expenses need to be deducted. Marketing expenses include all costs that arise for the merchandising and advertising of goods whose sales value is part of gross order value.
Special direct sales cost: Furthermore, for calculating profits apart from cancellations, returns, sales costs and marketing expenses, all other costs that can be attributed to goods that are included in gross order value have to be deducted too. These costs are called special direct sales costs, most prominent among which are usually cost of return (return process, return shipping as well as reprocessing and packaging of goods), cost of production (e.g. production of pictures and description of goods) and cost of warehouse and logistics.
Contribution margin 2: Contribution margin 2 shows net profitability: How much do I actually gain from selling my products, how much profit do I make after subtracting all lost revenues and all cost factors that can be attributed to goods and their sales?
 Furthermore: Discounts – a Never Ending Tale
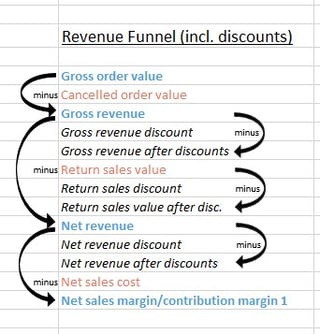
And if that wasn’t complicated enough, analysts face yet another struggle at every level of the revenue funnel: discounts. The problem is that discounts cannot just be deducted at a single level of the funnel. Instead – for the sake of a clean analysis and in order to be able to actually derive guidance from gained insights – they have to be broken down to particular levels: gross revenue has to be divided into gross revenue discount and gross revenue after discount, return sales value has to be divided into return discounts and return sales value after discounts and so on. The chart on the right illustrates where key discount figures can be found within the revenue funnel.
Revenue Key Figures – Key Facts:
Data source: ERP-System/Shop-System
Unit: Euro
Calculation: Quantity x Realized price
Responsibility: Depending on the type of revenue. In general, the superior levels of Marketing are mainly responsible for key figure performance. With return sales value, the responsibility is shared with Purchasing, Category Management and CRM.
Most important issue: Which products/channels/campaigns are top performers in terms of which type of revenue, which products/channels/campaigns result in revenue losses at what point?
You want to stay uptodate about the lates blog post or upcoming webinars? And you don't want to miss what's new with the minubo Analytics Cloud? That is no problem at all:


 nach Wunsch auch mit Videocall