
 ca. 30 Minuten
 nach Wunsch auch mit Videocall
In short:
This article lays out the numbers: What does it cost to build and run your own BI infrastructure over five years—for a small, medium-sized, and large e-commerce company? And where does it make sense to buy individual components instead of building them yourself? Here’s the result upfront: Over 5 years, buying is 60% to 66% cheaper, depending on company size, with savings ranging from €320,000 to €767,500, and productivity achieved in weeks instead of months.
This blog post explains in detail how we arrived at these numbers and what they mean specifically for your company, whether you’re small, medium-sized, or large.
MAKE OR BUY IS EVERYWHERE—INCLUDING IN BI
No retailer produces everything in-house. A fashion brand may design its own collections. But it doesn’t run its own textile factory. It makes a conscious decision about where its value creation lies and what it buys externally.
Business intelligence involves exactly the same decision: What do I want to build, operate, and own myself—and what is better purchased? Most companies massively underestimate one factor here: the total cost of ownership (TCO) of a self-built BI infrastructure. Not because the tools are expensive, but because hardly anyone calculates the personnel effort behind it in advance.
1. THE FRAMEWORK: WHO IS THIS ABOUT, AND WHAT IS BEING COMPARED?
What we are looking at is the build and operation of an in-house BI infrastructure (consisting of a data pipeline/ETL, data warehouse, and visualization) over a five-year period: Year 1 (setup plus prorated operations) and full ongoing operations from Year 2 onward.
THREE COMPANY SIZES, THREE REALITIES
An e-commerce company with €20 million in revenue and no or only a small tech team starts from a very different position than one with €150 million in revenue and its own 20-person tech team. Uniform figures would be misleading, so we distinguish between three tiers:
|
|
small |
medium |
large |
|
Annual revenue |
~20 Mio. € |
~50 Mio. € |
~150 Mio. € |
|
IT-/Tech-Team |
0-5 Personen |
5–15 Personen |
15+ Personen |
|
Source systems / connectors |
3–5 |
8–12 |
15+ |
|
Data volume (DWH) |
~50 GB |
~150 GB |
~400 GB |
|
BI starting point |
Primarily Excel |
First Tools already in place |
Partly evolved structures |
Salary assumption (fully loaded cost incl. ~25% overhead, DACH salaries): Data Engineer, DevOps/Admin, and BI Analyst/PM are each estimated at ~€90,000/year at 1.0 FTE.
2. THE BI VALUE CHAIN: WHAT ACTUALLY HAS TO BE BUILT?
Before talking about costs, it helps to look at what is actually being created. Think of your BI as a supply chain: at one end is raw data from your systems, at the other end is a decision made by an employee. In between lies a lot of work:
- ETL / Data pipeline: transport and extraction of raw data
- Transformation / Data model: Business-Logic, KPI definitions
- Data Warehouse: storage and performant querying
- Visualization / Frontend: dashboards, reports
- Usage and adoption: the people who work with it
Each of these building blocks can be built internally (**make**), purchased (**buy**), or combined (**make and buy**). This framework matters because the make-or-buy question should rarely be answered across the board, but rather for each component individually.
3. THE TCO OVERVIEW: WHAT DOES THE FULL BUILD APPROACH COST?
The following table shows the total cost of a complete in-house build (make), with prorated personnel costs in Year 1 because setup does not take equally long in every tier.
|
Cost block |
small |
medium |
large |
|
Setup (one-time) |
~37.000 € |
~72.000 € |
~150.000 € |
|
Tools p.a. |
~3.650 € |
~9.300 € |
~32.000 € |
|
Personnel year 1 (prorated by setup duration) |
~67.500 € (9 Mon.) |
~92.000 € (7 Mon.) |
~75.000 € (4 Mon.) |
|
Total Year 1 (Setup + prorated operations + tools) |
~108.150 € |
~173.300 € |
~257.000 € |
|
Personnel p.a. (full operations from Year 2) |
~90.000 € |
~158.000 € |
~225.000 € |
|
Total operating cost p.a. (from Year 2) |
~93.650 € |
~167.300 € |
~257.000 € |
Important: Personnel costs in Year 1 are calculated on a prorated basis because setup is assumed to take 3, 5, and 8 months respectively. Only after that does full operation begin. That means Year 1 includes both setup costs and prorated operating costs at the same time. This makes Year 1 the most expensive phase in the entire cycle.
4. SETUP COSTS IN DETAIL: WHAT HAPPENS IN THE FIRST FEW MONTHS?
During the setup phase, there is no productive operation yet. The team is fully focused on the build. Typical tasks include architecture decisions, tool selection, setting up connectors, building the data model, creating initial reports, and documentation.
- Data Engineer (100 %): Builds everything—architecture, pipelines, data model, connectors. Sequentially; no step happens without the previous one.
- BI Analyst / PM (50 %): Defines what should be built—requirements, KPIs, initial dashboards. Starts only once data begins to flow.
- DevOps / Admin (20 %): Sets up the infrastructure—cloud, access rights, security. This is done relatively quickly; the main workload comes later during operations.
|
Role / Effort |
small |
medium |
large |
|
Setup duration |
~3 Monate |
~5 Monate |
~8 Monate |
|
Data Engineer (100 %) |
~22.000 € |
~37.000 € |
~90.000 € |
|
BI Analyst / PM (50 %) |
~11.000 € |
~28.000 € |
~45.000 € |
|
DevOps / Admin (20 %) |
~4.000 € |
~7.000 € |
~15.000 € |
|
Total Setup |
~37.000 € |
~72.000 € |
~150.000 € |
5. TOOL COSTS P.A.: WHY TOOLS ARE NOT THE PROBLEM
At first glance, tool costs seem harmless—and they are. The real issue is the mountain of personnel effort behind them. So let’s take a look at tool costs for the DWH, data pipeline, and visualization.
DWH (BigQuery on-demand)
Pricing model: storage $0.02/GB/month, queries $5/TB scanned.|
Cost type |
small (~50 GB) |
medium (~150 GB) |
large (~400 GB) |
|
Storage p.a. |
~150 € |
~300 € |
~1.000 € |
|
Compute/Queries p.a. |
~400 € |
~800 € |
~2.000 € |
|
Total DWH p.a. |
~550 € |
~1.100 € |
~3.000 € |
Datenpipeline (ETL + Transformation)
ETL and transformation are technically two separate steps (transport vs. business logic), but they are combined here.
Airbyte Cloud (small/medium), Fivetran (large), transformation via dbt Cloud.
|
Component |
small |
medium |
large |
|
ETL tool |
Airbyte Cloud |
Airbyte Cloud |
Fivetran |
|
Connectors |
3–5 |
8–12 |
15+ |
|
ETL costs p.a. |
~2.000 € |
~5.000 € |
~12.000 € |
|
dbt Cloud (Seats) |
1 Seat |
2-3 Seats |
4-5 Seats |
|
Total Pipeline p.a. |
~2.500 € |
~7.000 € |
~17.000 € |
Visualization/ Frontend
Power BI Pro (small/medium) (~€10/user/month), Tableau for large companies (mix of Creator + Viewer—conservatively estimated; a full Creator rollout would be ~€22,000).
|
Criterion |
small |
medium |
large |
|
Tool |
Power BI Pro |
Power BI Pro |
Tableau (Mix) |
|
User |
5 |
10 |
25+ |
|
Total p.a. |
~600 € |
~1.200 € |
~12.000 € |
|
Total Tools p.a. |
~3.650 € |
~9.300 € |
~32.000 € |
Context: ~€3,650 p.a. for tools at a small e-commerce company sounds low. And it is. The real question is: Who operates all this? The answer: people.
6. PERSONNEL COSTS P.A.: THE REAL COST DRIVER
BI is not a project—it is an ongoing operation. And ongoing operations need people, permanently. Three roles are required:
- Data Engineer: monitors and maintains data pipelines, debugs errors when source systems change, connects new data sources, further develops the data model, ensures data quality. There is no state in which “everything is finished”; source systems change continuously.
- DevOps / Admin: operates and monitors cloud infrastructure, cost monitoring, access rights and user management, security and compliance (GDPR), updates, incident management.
- BI Analyst / PM (Doppelrolle): creates reports and dashboards, performs ad hoc analyses for stakeholders, checks data quality, defines KPIs, prioritizes requirements, translates between business and the Data Engineer, maintains documentation.
This dual role is a single point of failure. At small e-commerce companies, this is often an internal person who “also does this,” on top of their actual job. If they are unavailable, the entire BI function comes to a halt.
|
Role |
small |
medium |
large |
|
Data Engineer |
0,3 FTE – ~27.000 € |
0,7 FTE – ~63.000 € |
1,0 FTE – ~90.000 € |
|
DevOps / Admin |
0,2 FTE – ~18.000 € |
0,3 FTE – ~27.000 € |
0,5 FTE – ~45.000 € |
|
BI Analyst / PM |
0,5 FTE – ~45.000 € |
0,75 FTE – ~68.000 € |
1,0 FTE – ~90.000 € |
|
Total FTE |
1,0 FTE |
1,75 FTE |
2,5 FTE |
|
Total personnel p.a. |
~90.000 € |
~158.000 € |
~225.000 € |
Depending on company size, however, these roles are not needed as full-time positions. This exact dilemma—too small for a full role, too important for no role at all—is also described by Marcus Anton, CEO of GOLDNER Fashion Group, based on his own experience when thinking about building a completely in-house data architecture that would also have failed due to labor market realities:
„We wanted to build a complete architecture of our own and quickly stepped back, not least because of staffing issues. We saw how difficult it is to permanently staff a team of the necessary size for a project like this. If you want a cloud setup, you don’t need a full-time admin—but try hiring for a 0.1 FTE role."
That is exactly the core of the personnel problem in self-built BI: the tasks are real and ongoing, but they cannot be packaged into neat, fillable job profiles. The case study „GOLDNER Fashion: AI-ready Data Infastructure" shows how GOLDNER solved this conflict without giving up data sovereignty. It is a strong next step if this dilemma sounds familiar from your own team.
7. THE ICEBERG: WHAT IS NOT INCLUDED IN THE NUMBERS
The euro figures above are only the tip of the iceberg. What lies beneath is harder to quantify, but potentially larger than all visible costs combined.
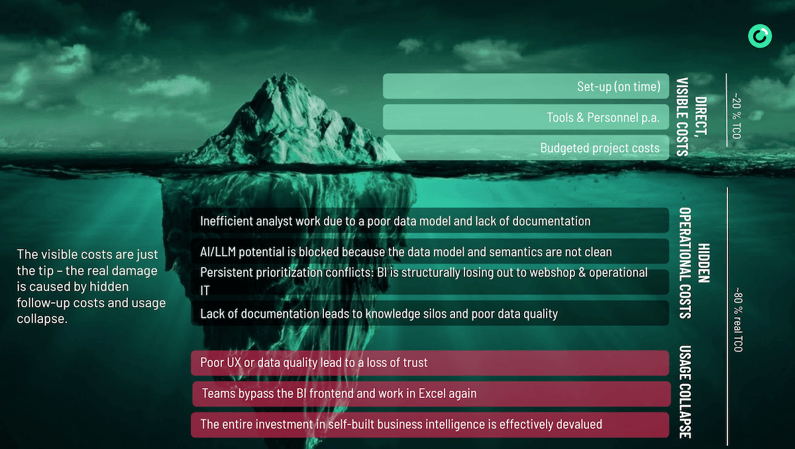
Hidden downstream operating costs
- Analysts need longer for reports → higher ongoing personnel costs
- No clean semantic layer → LLM/AI integration not possible
- Documentation debt grows over time
- BI competes with the webshop, marketing tools, and more, and structurally loses because BI does not show a directly visible revenue contribution
- Stagnating stack due to continuous prioritization conflicts
Adoption collapse (the most severe case)
- Poor UX or data errors → loss of trust among employees
- Reversion to Excel: the tool is no longer used
- Makes all previous investment effectively worthless
The figures in Section 3 only apply if everything goes right: no adoption collapse, no poor data model, no prioritization conflicts. In practice, that is the exception, not the rule.
8. MAKE OR BUY: BACK TO THE VALUE-CREATION QUESTION
The question is not, “Do I build everything myself?” The question is: Where does my differentiation lie, and what is better purchased?
|
BI building block |
Typical make argument |
Why buy is often the better option |
|
Extraction and preparation (ETL) |
“We have very specific source systems” |
Standard connectors cover most common e-commerce sources and are continuously maintained |
|
Modeling (DWH) |
“We need full control” |
Commodity: little differentiation potential, but high operating effort |
|
KPIs and semantics |
“We define our KPIs ourselves” |
Building a comprehensive, consistent set of KPIs including logic, definitions, and AI-ready semantics takes years |
|
Tools / visualization |
“We want our own dashboards” |
Existing tools (Power BI, Tableau, etc.) can continue to be used; it’s not an either-or decision |
|
Usage and adoption |
“No one can buy that” |
Training and structured onboarding can absolutely be purchased |
There is no building block for which *make* is inherently wrong. But the decision should be made consciously for each one, with cost, risk, and differentiation potential in mind.
9. THE TIME FACTOR: WHAT THE TCO TABLE DOES NOT SHOW
Cost is one thing. Time to productivity is often the decisive factor—and it is almost always underestimated.
Make: months to years until full functionality
The following values are model assumptions based on typical project trajectories plus experience from our customer conversations with mid-market e-commerce companies; they are not the result of a representative study.
|
Phase |
small |
medium |
large |
|
Setup / technical build |
~3 months |
~5 months |
~8 months |
|
First stable reports |
+2–3 months |
+3–4 months |
+4–6 months |
|
Reliable, trustworthy numbers |
6–12 months |
9–18 months |
12–24 months |
|
Broad employee adoption |
+6–12 months |
+6–12 months |
+12 months |
|
Full functionality (realistically) |
12–24 months |
18–30 months |
24–36 months |
This is how the line “Reliable, trustworthy numbers” is derived: it builds on the line “First stable reports” and adds a buffer for validation and trust-building—meaning several full reporting cycles without major corrections, reconciliation of old and new figures, and fixing data quality problems that only become visible during live operations. For a small e-commerce company, for example: setup (~3 months) plus first stable reports (+2–3 months) equals 5–6 months, followed by further months of validation until the numbers are considered reliable, resulting in a total of 6–12 months. This range is also a model assumption, not a fixed formula: how quickly numbers are truly considered trustworthy depends heavily on the data quality of the source systems and the care taken in the data model.
This is how the line “Full functionality” is derived: it is not a separate estimate, but the sum of the two critical stages above it—the point at which reliable numbers are available, plus the time until those numbers are used in everyday work by the broader organization. For a small e-commerce company, for example: 6–12 months until reliable numbers plus another 6–12 months until broad adoption equals 12–24 months until full functionality. “Full functionality” therefore does not mean “the first report is finished,” but rather the point at which the BI infrastructure truly arrives in day-to-day operations: reliable numbers that are used by all relevant teams and are no longer questioned.
During this time: no data-driven work, no AI-assisted analyses, no scalable reporting—while personnel costs continue to accrue.
Buy solutions: months instead of years until productivity: Setup duration depends on company size: ~1–2 months (small), ~3–4 months (medium), and ~4–6 months (large). Everything else (data model, KPIs, frontend) is already in place, and employee onboarding runs in parallel.
10. A SOLUTION FOR EVERY INFRASTRUCTURE: THE MODULAR HYBRID APPROACH
Purchased BI is not an either-or decision, nor is it a complete package that must be bought as a whole. If you already have existing tools or structures, you do not need to give them up. minubo offers three product tiers to match your own infrastructure:
|
Product |
For whom |
What it covers |
|
minubo Suite |
Lean infrastructures: e-commerce companies without an in-house BI team |
End-to-end from source to report: extraction and preparation + modeling (800+ KPIs and semantics) + provision as a structured, managed DWH + visualization and insights (best-practice BI tools, self-service) |
|
minubo DWH |
Growing infrastructures: existing BI frontend already in place |
Extraction and preparation + modeling (800+ KPIs and semantics) + provision as a structured, managed DWH with Easy Connect to your own tools (Power BI, Tableau, LLMs, n8n, …) |
|
minubo Data |
Mature infrastructures: own stack is running, own DWH already in place |
Extraction and preparation only + modeling only (800+ KPIs and semantics): clean e-commerce data for your own BI/AI infrastructure |
All three products share the same foundation: 800+ e-commerce KPIs including consistent logic and AI-ready semantics, reliable extraction of all relevant e-commerce sources without needing your own team, and connectivity without vendor lock-in (Easy Connect to Power BI, ChatGPT, Claude, n8n, and more).
A note on the TCO calculation: The cost comparisons in this article refer to the minubo Suite as the complete package. Anyone starting with minubo DWH or minubo Data pays correspondingly less. The logic remains the same: the more building blocks you buy, the lower the internal personnel effort.
GOLDNER again provides a practical example of how such a hybrid approach works. Instead of building everything internally or outsourcing everything completely, the company chose a modular hybrid approach. The technical core (extraction, preparation, modeling) runs in a standardized way via minubo, while the GOLDNER team retains full control over competitively critical custom logic. Marcus Anton describes the goal like this:
„We wanted to move away from 80/20 maintenance toward 20/80—so the team can put the energy it has into development."
Anyone wanting to understand how standardization and individuality can be cleanly separated at the architecture level will find the technical details—from orchestration and the bronze/silver/gold principle to the Data API for LLM access—in the case study „GOLDNER Fashion: AI-ready Data Infrastructure".
11. THE DIRECT COST COMPARISON: BUILD VS. MINUBO SUITE
Now we come to the core of the article. The table makes it immediately visible how much cheaper and how much faster the buy approach can be.
Assumptions behind the minubo personnel line: During the onboarding phase, a 0.5 FTE project lead is included on a prorated basis for coordination and requirements management (same salary logic, ~€90,000/year at 1.0 FTE). During ongoing operations, no permanent internal personnel effort for operating the infrastructure is included: the infrastructure-related tasks that belong to the BI Analyst/PM role in the build approach (defining KPIs, building dashboards and reports, checking data quality, maintaining documentation) are handled by minubo. What remains is the actual business analysis—the substantive evaluation and interpretation of the numbers by the business team. That effort occurs equally in both make and buy and is therefore deliberately excluded from the comparison.
|
Cost block |
Build |
minubo |
Build medium |
minubo medium |
Build |
minubo |
|
Setup / onboarding (one-time) |
~37.000 € |
~5.000 € |
~72.000 € |
~8.000 € |
~150.000 € |
~15.000 € |
|
Onboarding personnel (one-time) |
— |
~7.500 € |
— |
~15.000 € |
— |
~22.500 € |
|
License / tools p.a. |
~3.650 € |
~30.000 € |
~9.300 € |
~54.000 € |
~32.000 € |
~96.000 € |
|
Personnel p.a. (operations, full operation) |
~90.000 € |
— |
~158.000 € |
— |
~225.000 € |
— |
|
Total Year 1 |
~108.150 € |
~42.500 € |
~173.300 € |
~77.000 € |
~257.000 € |
~133.500 € |
|
Savings Year 1 |
— |
~65.650 € |
— |
~96.300 € |
— |
~123.500 € |
|
Total p.a. |
~93.650 € |
~30.000 € |
~167.300 € |
~54.000 € |
~257.000 € |
~96.000 € |
|
Savings p.a. (from Year 2) |
— |
~63.650 € |
— |
~113.300 € |
— |
~161.000 € |
|
Total 5 years |
~482.750 € |
~162.500 € |
~842.500 € |
~293.000 € |
~1.285.000 € |
~517.500 € |
|
Savings over 5 years |
— |
~320.250 € |
— |
~549.500 € |
— |
~767.500 € |
|
Time to full functionality |
~12-24 months |
~1–2 months |
~18-13 months |
~3–4 months |
~24-36 |
~4–6 months |
Key takeaways from the table:
-
Across all three company sizes, minubo Suite is 48% to 61% cheaper in Year 1 than the build approach.
-
From Year 2 onward, ongoing savings range from 63% to 68%, despite higher license costs, because personnel effort drops dramatically.
-
Over 5 years, total savings add up to 60% to 66% of total cost.
-
The key lever is **not the license**, but the eliminated personnel effort: no Data Engineer in full operation, no DevOps, no BI PM effort for infrastructure.
-
On top of that comes the time advantage: **buy solutions are productive after just 1 to 6 months**, while the build approach takes **6 to 24 months until full functionality**—that is, until numbers can be used by the broader organization in daily work.
-
And this is not only about cost, but also about risk: a self-built solution can fail for exactly the reasons outlined in Section 7 (adoption, data model quality, prioritization), while a purchased solution is already proven in productive use.
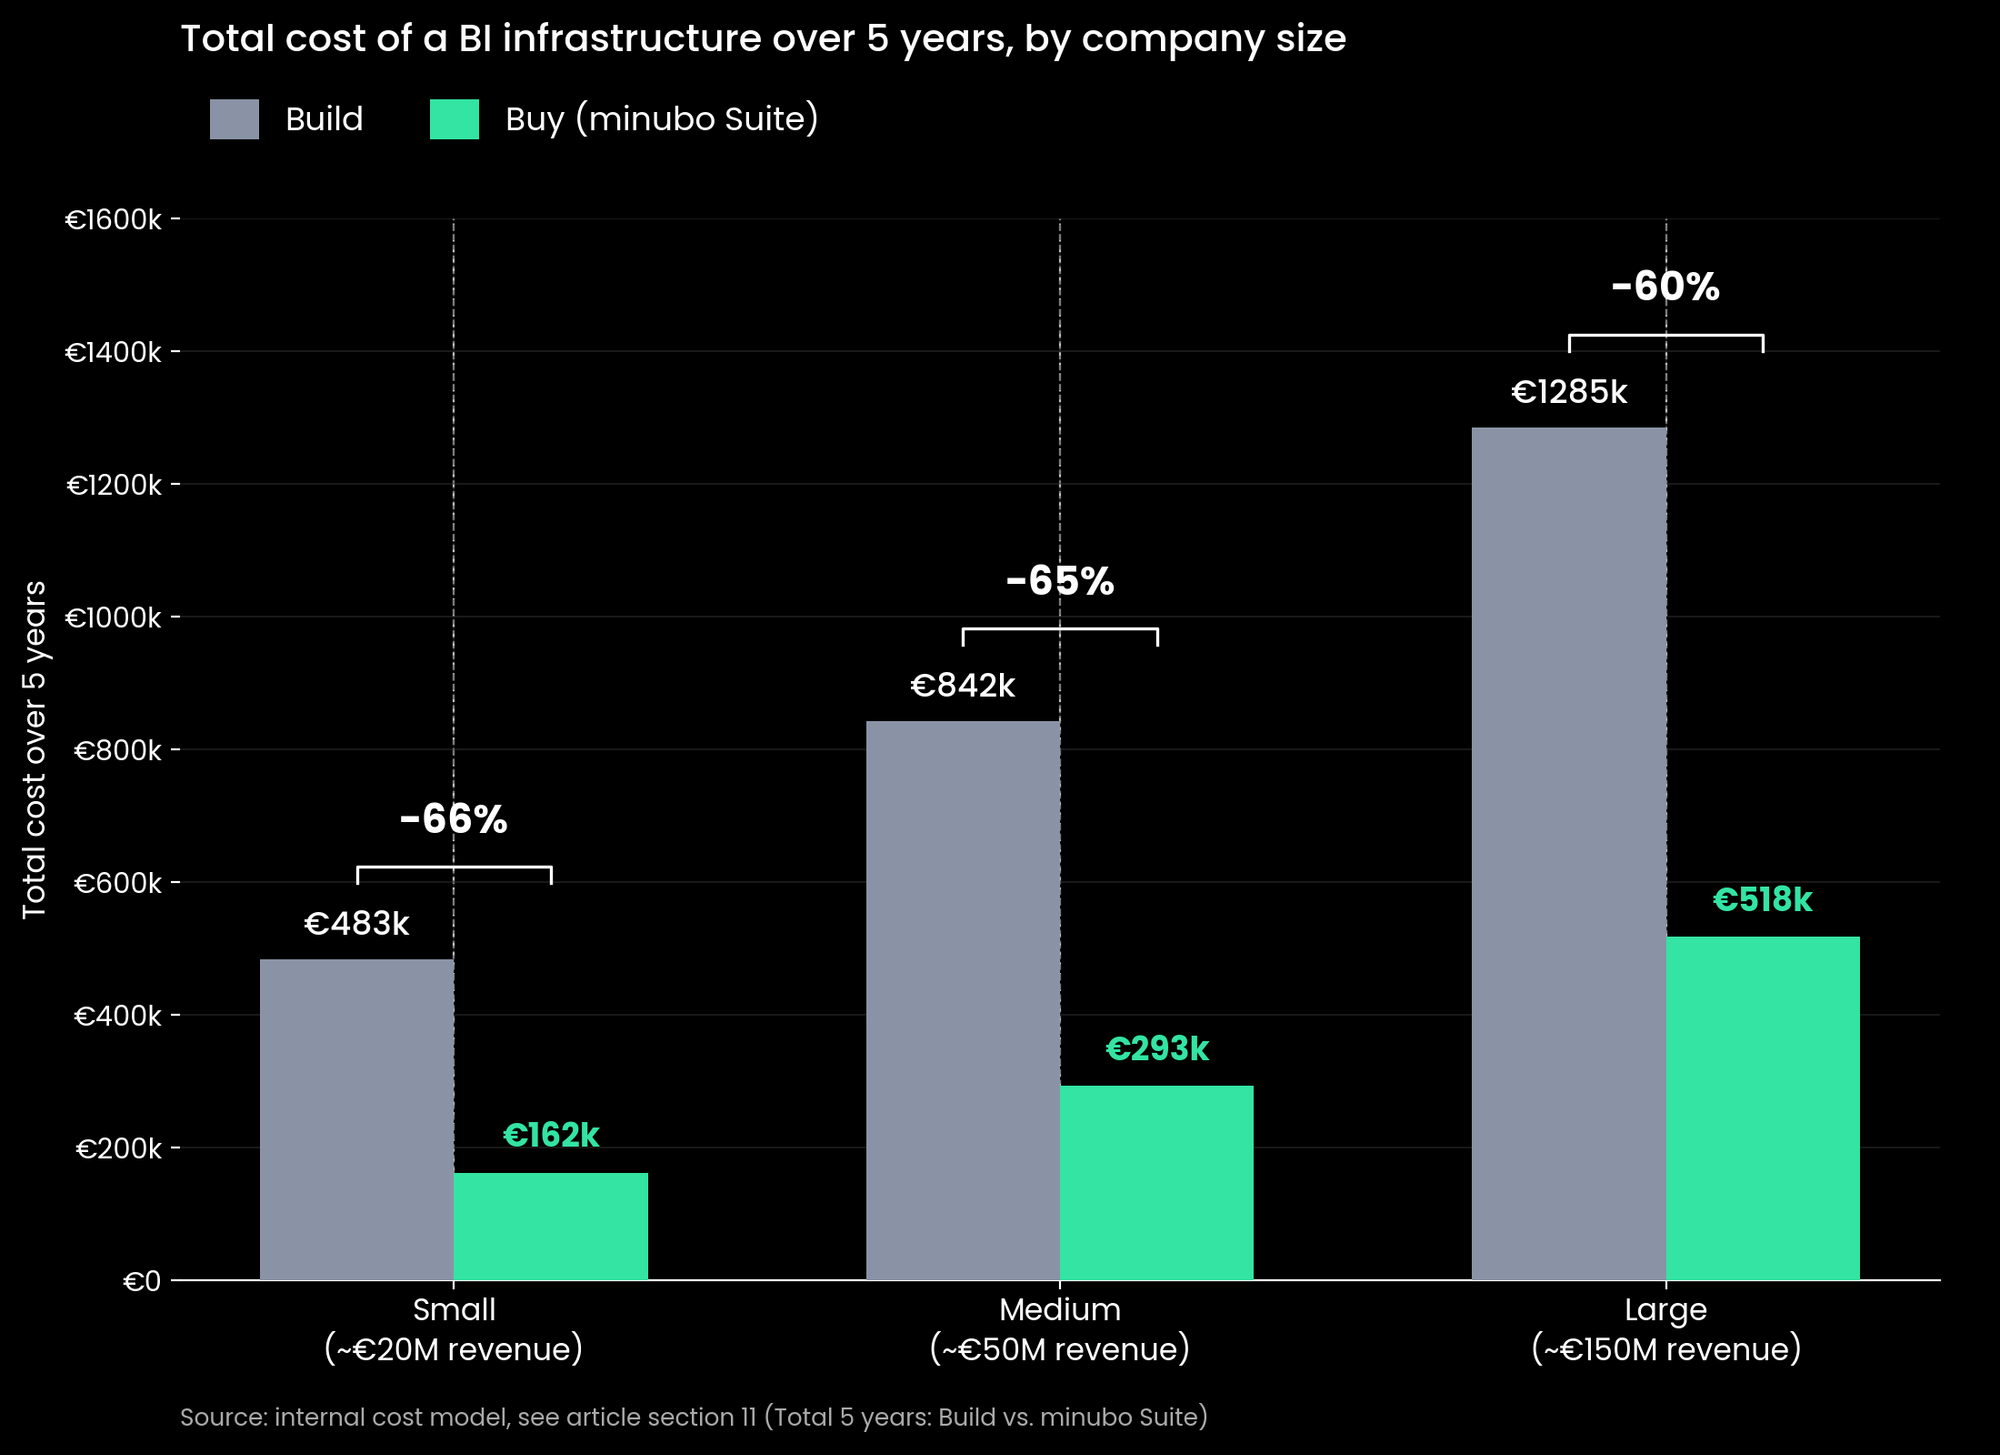
Fig. 1: Total cost over 5 years, in-house build vs. minubo Suite, by company size.
And don’t forget: every week without data-driven work comes at a price that does not appear in any table—lost decision confidence, missed margin, and automation potential left untapped.
12. CONCLUSION: THREE QUESTIONS YOU SHOULD ASK YOURSELF
Instead of a classic conclusion, here is a concrete decision framework for you.
Question 1: Where does my differentiation lie? Which BI building blocks are truly unique to my business, and which are commodity?
Question 2: What can I realistically own? Do I have the team, the time, and the prioritization power to run BI internally over the long term and drive employee adoption?
Question 3: What does every week without productive BI cost me? Not just in euros, but in decisions made without a reliable data foundation.
Make or buy is not a fundamental yes-or-no decision—it is a question for each building block. And the answer can change as your company changes. What should not be variable is the ambition to work data-driven as quickly as possible.
Let’s go through together which building blocks make sense for you.

FREQUENTLY ASKED QUESTIONS (FAQ), SUMMED UP ONCE MORE
What does an in-house BI infrastructure cost in the first year? Depending on company size, between ~€108,150 (small e-commerce company, ~€20 million revenue) and ~€257,000 (large e-commerce company, ~€150 million revenue), including setup costs, tools, and prorated personnel costs.
How many full-time roles does an in-house BI infrastructure tie up permanently? In full operation from Year 2 onward, it is 1.0 FTE for a small, 1.75 FTE for a medium-sized, and 2.5 FTE for a large e-commerce company, spread across Data Engineer, DevOps/Admin, and BI Analyst/PM.
How long does it take to build an in-house BI infrastructure to full functionality? Realistically between 12–24 months (small), 18–30 months (medium), and 24–36 months (large), from the first architecture decision to broad employee adoption.
Is building your own BI infrastructure worth it at all? For companies whose core business is not data processing, rarely. Over 5 years, the personnel effort required for operation and maintenance exceeds the cost of a purchased solution by 60% to 66%, while taking significantly longer to become productive. A hybrid approach usually makes more sense: buy the standardized basics, build the differentiating pieces yourself.
Sources for external tool pricing: Google BigQuery Pricing, Airbyte Cloud Pricing, Fivetran Pricing, dbt Cloud Pricing, Microsoft Power BI Pricing, Tableau Pricing (calculation status: June 2026).