nach Wunsch auch mit Videocall
This is what this blog-series is all about:
Tableau, Looker, Incuda, Power BI or Supermetrics - they all do some kind of magic with data and often this is labelled as Business Intelligence (BI), but where exactly is the BI? The selection of software solutions is large and now it has become difficult to keep track of all the offerings. This guide provides a remedy in the form of 4 consecutive blog articles - based on our comprehensive BI-centered consulting and development activities in the online sector. For everyone who wants to understand the differences. And especially for online retailers.
Episode directory
- Business Intelligence - see the big picture. Retailers have to consider this in their BI decision
- Tableau vs. minubo - Business intelligence software compared
- Supermetrics vs. minubo - Business intelligence software compared
- Looker vs. minubo - Business intelligence software compared (coming soon)
Episode 1
Business Intelligence - See the Big Picture
Retailers have to consider this in their BI decision
As a retailer, why should you even think about the use of your data? 1) Data creates transparency, measurability and thus control. 2) Data provides insights to be able to make better decisions. 3) Data allows an individualized and targeted customer approach, automation and personalization.
So far so good but probably nothing new: access to data, extracting, processing and analyzing it is a critical factor for the success of an online retailer and their business model. Sounds easier in theory than in practice, because the ever-increasing amounts of data require IT-supported systems and applications to get an overview and insight into the processes and company data. Access to relevant data is often limited because it is available in different systems, sources and applications, and thus in isolated internal company silos, and is therefore not centrally available. Does that sound familiar to you?
Now there are two options: You can either use the limited functionality of your silos and accept that you will not see either consolidated or meaningful data, or you can opt for a more appropriate modern Business Intelligence solution that is ideal for holistic data analysis, reporting and dashboarding.
The Big Data Ecosystem
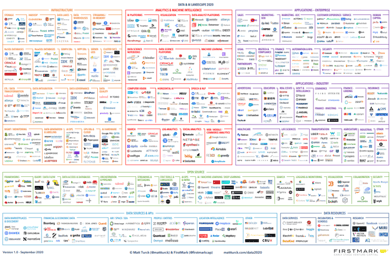 Different technologies, categories and companies as far as the eye can see. They all do some kind of magic with data and often they say Business Intelligence, but where exactly is BI and is it not just a decorative buzzword? And who can still keep track of things? There is often an overlap in software solutions, but data technologies usually have their own requirements, tools and regulations. In this blog series, let's develop an understanding of this ecosystem, understand which areas the individual software providers cover, what differentiates them and what requirements they are actually made for. To do this, we first take a look at which components a classic Business Intelligence infrastructure contains and how it is structured.
Architecture of a Business Intelligence Solution
To be able to classify the various software providers according to their functionality, a general understanding of the structure and the different components of a Business Intelligence solution helps.
Basically, a BI infrastructure requires the following 4 levels, each of which takes on a specific task:
- Data sources
- ETL process
- Data warehouse
- Data analysis and visualization
These levels take on different tasks, such as collecting, storing, analyzing and visualizing data. They can either be implemented with the help of a standardized complete solution - such as the minubo Business Intelligence solution - or different partial solutions. A decisive factor for the classification of the numerous software providers is therefore the understanding of the structure and function of a BI architecture, which we discuss in detail below:
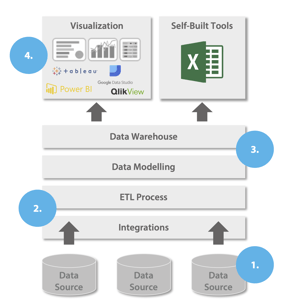 Level 1: Data Source (Collect)
The first level, Data Source, does not belong directly to the BI system. They contain the isolated raw data, which is decentralized, redundant and unlinked in the individual applications and tools of the company. This can be, for example, transactional or operational data such as orders, web sessions, campaigns, touchpoint data, customer and product master data from CRM, shop systems, web tracking, ERP or merchandise management. But they can also include external data sources, such as online databases or market and competition data.
Level 2: ETL (Integrate)
Level 2 is about data integration. This is done with the help of the so-called ETL Process (Extract, Transform and Load), which extracts the information from the source systems and integrates it into a central database or a data warehouse, the so-called target storage, via interfaces.
This ETL Process is divided into three phases: 1) The data is extracted from the various upstream systems and organized in such a way that their format and structure are consistent (Extract). 2) In the next step, the data is transformed from the source to the target database, cleaned and made available in a standard format (Transform). This ensures that the data is in the correct form and, in the last step 3) is integrated into the target database or the data warehouse (Load) and made available for easy access and further analysis.
The role of an ETL Process is very important for Business Intelligence. ETL significantly increases the availability and value of data and its quality. Data silos are overcome, the previously separate data sources no longer have to be linked manually, but are now consolidated at a central location. The raw data is transferred into valuable information, freed from errors and aligned according to standards, so that the data can be reliably evaluated and can thus serve as a basis for data-driven decisions company-wide. The creation of an ETL process requires a continuous effort, as both the source systems and the output requirements are constantly changing and growing.
Level 3: Data Warehouse (Save)
One of the fundamental architectural components of a Business Intelligence solution is data storage - the Data Warehouse (DWH). The DWH is mass storage that is optimized to provide large amounts of data for analytical data queries with high performance. The performance of a DWH is primarily characterized by the query speed. A wide variety of data queries can be carried out with high performance for analysis purposes with short execution times.
A DWH thus enables a global view and access to a consistent database and thus queries to all required levels of detail and aggregation, a key for really valuable work with data. Snowflake, or Exasol, are among the solutions that pursue the goal of transforming a company's data landscape into a flexible DWH and thus making it available for analysis and as a business decision-making aid.
Level 4: Data Analysis and Visualization (Analyse)
As a rule, users do not access the data in a DWH directly, but use third-party systems for data visualization and analysis to be able to easily capture developments, distributions, trends and relationships at a glance. In this way, data becomes knowledge and practically implementable measures that help companies and employees to work more data-driven.
A front end with easy-to-use tools for operational staff is therefore a central requirement for modern BI so that the business questions asked can be answered quickly, as precisely as possible and, above all, independently based on the available data. Data should be retrievable by the specialist departments in self-service and not have to be requested centrally from the IT or analyst team, as is usual with traditional BI, to avoid waiting time and to enable data-driven decision-making quickly and without detours.
A large number of software providers are available on the market for this. In addition to Tableau, Google Data Studios and QlikView, Power BI is probably one of the best-known visualization tools. These solutions offer numerous possibilities when it comes to creating clear reports, dashboards and ad-hoc analyses. To use these tools in a targeted manner and actually use their strengths, a solid data infrastructure is required, because: the output from these tools is only as good as the input.
How do I get my Business Intelligence Solution?
The components of a Business Intelligence solution are now clearly defined, but one question remains unanswered: How can I establish such a BI infrastructure in my company? There are two solutions here: 1) I buy a “complete Business Intelligence solution”, that is, standardized software - like the minubo Business Intelligence solution - that covers all of the above-mentioned levels or 2) I build my own Business Intelligence stack with individual components (bought or even built yourself). Let us examine the two possibilities - using the example of minubo and a tech stack built with Tableau - and use a few criteria to explain the advantages and disadvantages in more detail.
|
Business Intelligence complete solution |
Compound Business Intelligence Stack |
|
|
Data Modelling |
Thanks to an integrated best practice data model and predefined eCommerce key figures, there is no need for time-consuming data modeling and lengthy definition work. Together with industry experts such as Project A, Spryker and the bevh (the retailer association), minubo has developed a comprehensive model of retail key figures, KPI sets and report templates, and has made it available to the public - above all, of course, to the retailers themselves. You can find it here. |
Complex data must be brought into a consistent, sustainable data model, which requires expertise and continuous maintenance - especially since data models with new sources and requirements grow over time. Many projects fail here because data modeling is often greatly underestimated, especially when it comes to technical challenges. |
|
Control Over Setup |
No direct tech access, but quick implementation competence building of individual requirements with the software provider is possible - often even faster than internal cycles. |
Full control over support, maintenance, setup adjustment and expansion as well as further development. |
|
Competence Building |
Knowledge building through built-in best practices, comprehensive documentation and dedicated customer support and advice. |
Development of expert knowledge and data infrastructure competence during the development process; Risk of loss, as knowledge depends on individuals. |
|
Economies of Scale |
Interfaces with one-off development effort are used by many customers. These and the costs of computationally intensive analyses can thus be shared. |
None |
|
Time to Productive Use |
Onboarding in just a few weeks; then successive setup adjustments / extensions if required. |
The concept, development and testing for the initial setup generally takes at least two years. |
|
Costs |
In the 5-year time horizon, the costs can be seven times lower than for an in-house BI project. Details can be found here. |
In the 5-year time horizon with simple self-made BI (development and maintenance) > 2M € for personnel and tech costs. |
|
Tech Investments |
Tech costs significantly reduced due to multi-client economies of scale in the central infrastructure. |
Complete infrastructure has to be paid for and maintained. |
|
Resource Expenditure (personnel) |
None |
Project staff (Business & BI / Analytics) and Dev / DevOps staff (initial development, hosting, ongoing maintenance). |
|
Investment Risk |
No capital commitment through own staff / infrastructure. Annual cancellation possible, no permanent costs / legacy setup |
Large investments in your own personnel and infrastructure have to be made - this leads to high capital commitment |
|
Usability |
Thanks to intuitive data access, every employee using self-service can self-sufficiently and independently access relevant data. |
Often, IT professionals and analysts need to extract data for business stakeholders on demand. The development effort is significantly increased, or the stack is supplemented by various special tools for individual departments if broader self-service is to be made possible for the user. |
The Way through the Tool Landscape
So far so good. We now know that data collection, integration and provision are prerequisites for a successful Business Intelligence solution. And we also know that this BI infrastructure can be made available either via a standardized and complete Business Intelligence solution or in an in-house project via an individually compiled “Business Intelligence Stack”.
It became clear that purchasing a complete BI solution often seems to be the better choice for retailers. Although there are advantages to the in-house project in terms of individual requirements coverage, control over the setup and in-house competence development, it also became clear that such a project is usually much longer, more expensive, riskier and more challenging to implement. For readers who already use software, a combination of standardized BI and an individual tech stack could be an appropriate scenario.
Whatever the choice of infrastructure setup, the most important question remains: which technology best covers which requirements? And how exactly do they differ from one another - because not everything that is labelled BI, is BI. So, it's time to take a closer look at Tableau, Supermetrics, Looker, DynamicAction and PowerBI:
Article 2) Business Intelligence Software Compared - Tableau vs. minubo (coming soon)
If you have decided to take a do-it-yourself approach, I recommend the following reading: The Commerce Intelligence Blueprint. This paper describes the basic approach to a BI project and its most important success factors.