nach Wunsch auch mit Videocall
Yes, the new year has long been getting busy again, but still, we want to take a look at the previous year und share the major facts and numbers of 2016 with you. But we do not want to do this in the form of a traditional year-end reporting or packed in a simple blog post with incomprehensible numbers and diagrams. For our 2016 annual review, we’ve decided to use another form of presentation – we've combined all major facts and numbers within this infographic.
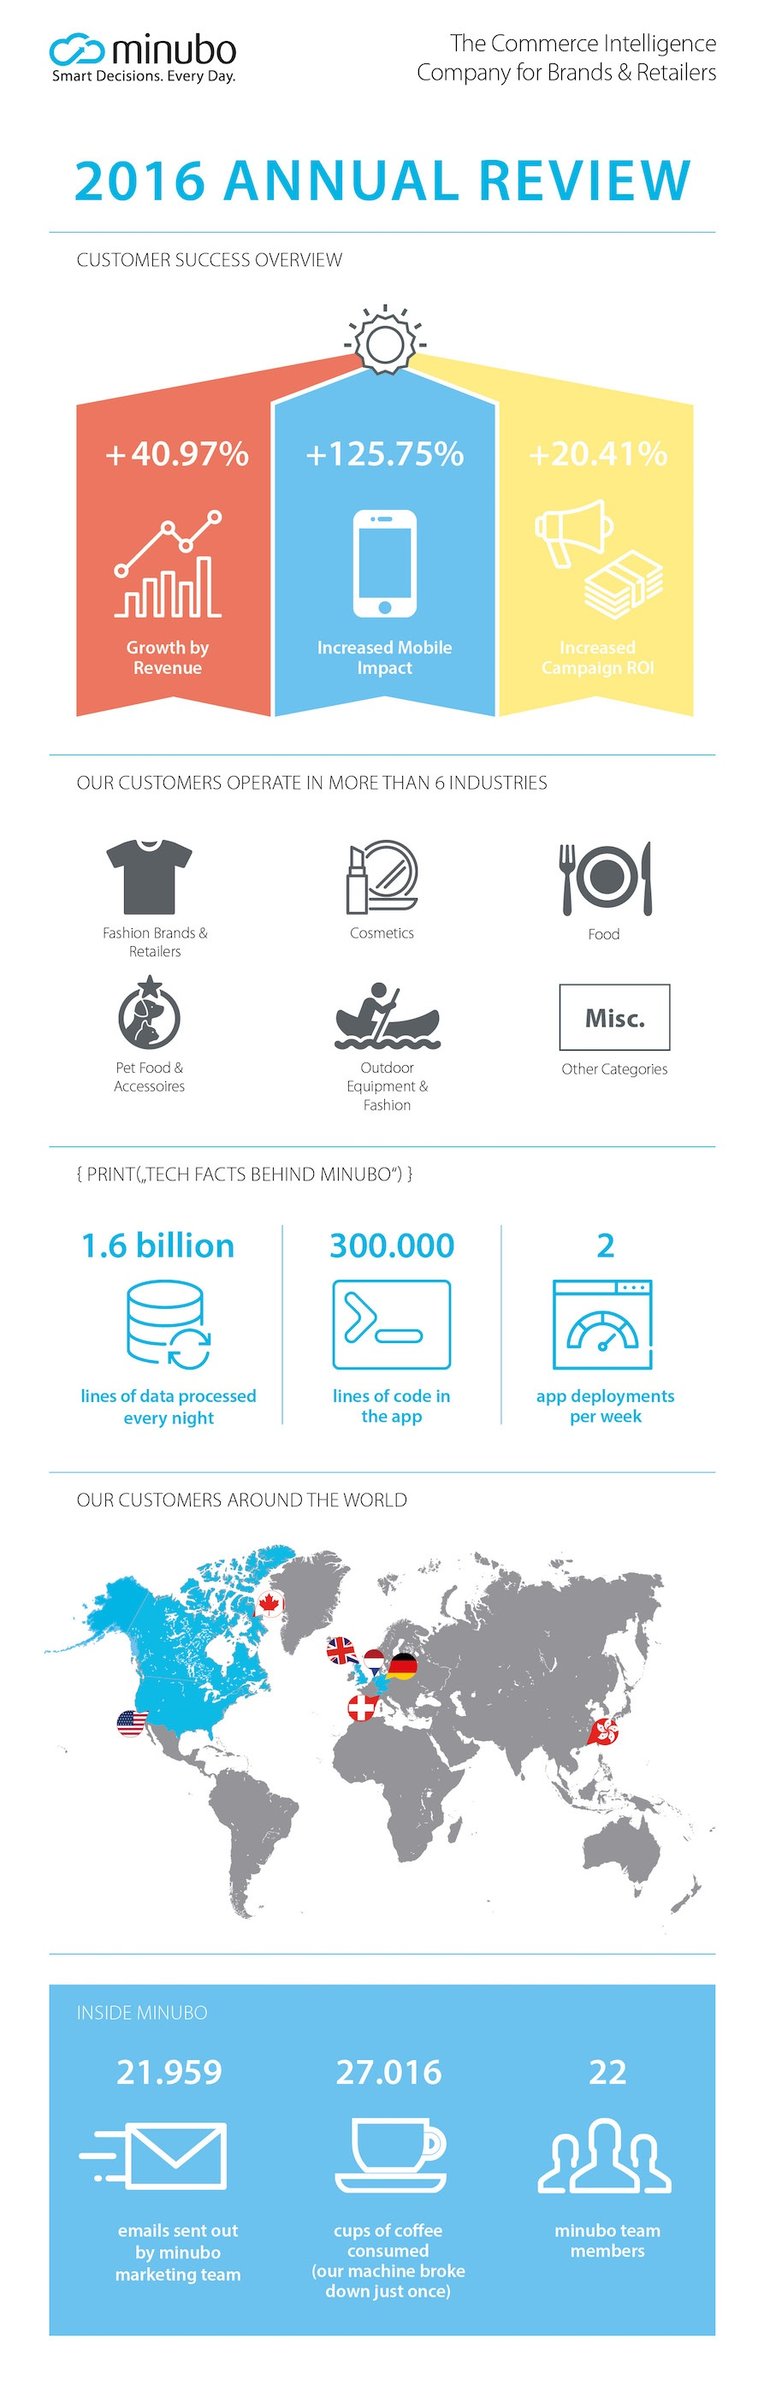
You can expect a great mixture of internal company information and data regarding the minubo customers. Thereby, questions will be answered like in which industries our customers operate and from which countries they come from. Furthermore, the infographic contains technical data regarding the minubo Analytics & Insights App and a glimpse behind the scenes of our company. But at the forefront we present the performance-based figures of the minubo customers – average growth rate, average mobile impact on revenue and the average campaign ROI.
But see for yourself!
You want to stay uptodate about the lates blog post or upcoming webinars? And you don't want to miss what's new with the minubo Analytics Cloud? That is no problem at all: