Fresh from the laboratory: minubo Webanalytics Widgets! They have always been available in the aggregated data basis, accessible via Microsoft Excel – now they are visible in the Web Frontend as well.
Based on the connection of online and offline data (offline = post-purchase, so e. g. connection of Customer Journey data from the Webanalytics system with return data from the commodities management or customer data from the CRM), minubo provides the online-retailer with precious information not only about visits and conversions as Google analytics does as well, but also about revenues and sales margins – attributed to certain channels by suitable attribution models, easily legible in the Web Frontend’s Dashboards.
Accordingly, we can easily answer the frequently asked question for minubo’s added value compared to classical Webanalytics tools: minubo performs holistic analyses – the aggregation and integration of really all your webshop’s data, generated online as well as offline, allows comprehensive insights in your business processes’ every detail.
Let’s do some short introducing: minubo Webanalytics
A good example for your data’s holistic exploitation, aggregated and integrated from shop system, Webanalytics, commodities management etc., is the Widget Net Sales Margin by Channel:
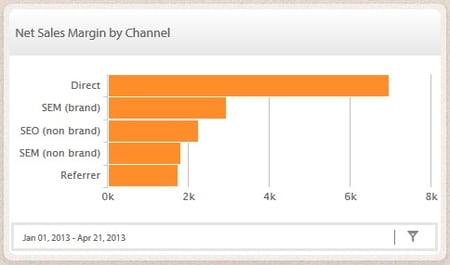
By merging the online shop’s data generated online and offline in a holistic Data Warehouse, minubo allows the attribution of sales margins to single channels. Thus, it becomes clearly evident to you as an online-retailer which channels are the really productive ones. By taking the “bathtub” attribution model as a basis, this doesn’t happen considering the Last Touchpoints only, but including the Customer Journey’s every previous station, sensibly weighted, as well.
In the Widget Revenues by Channel, the attribution is not only implemented by the “bathtub” model as it’s the case with minubo standardly, but by the “Last Touchpoint” principle additionally. Thus, the Last Touchpoints can be attributed with a greater importance regarding the achieved revenues, if required:
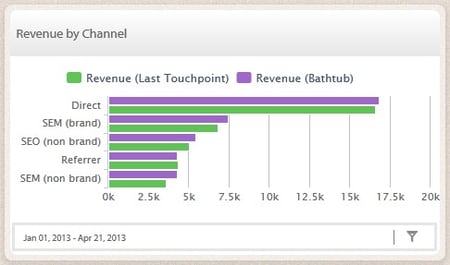
Combined with further Widgets as e. g. the Average Touchpoints per Journey, minubo enables every webshop to analyze its customers’ Customer Journeys in detail and subsequently optimize its customer and channel management strategically.
Among those features all around channel attribution and Customer Journey, minubo also has the classic Webanalytics metrics in its portfolio, of course:
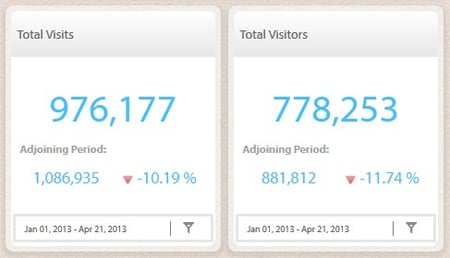
Total Visits and Total Visitors – as every Webanalytics tool does, minubo differentiates between total visits and visits by unique visitors. The metric Total Visitors accordingly counts every visitor just once, even if he visits the website repeatedly.
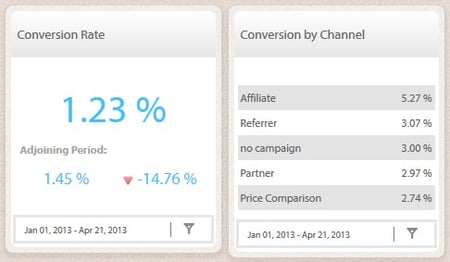
The Conversion Rate is one of the central Webanalytics metrics as well. In the left Widget, it is displayed as a simple single value, in the right one we see the Conversions broken down to single channels – based on the “bathtub” model again. This enables every online-retailer to track which channels provide him with many buying customers and which ones (in comparison with the Widget Visits by Channel as well) take in rather those customers who leave the shop without having bought anything.
Additionally, minubo provides a combined Widget for this purpose:
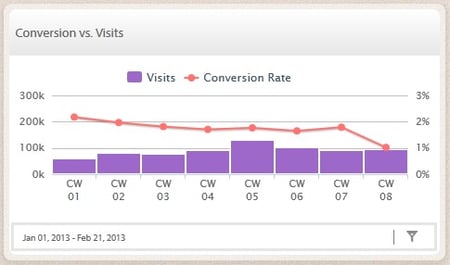
By using different filters (e. g. time interval, gender, product category or country), the displayed metrics can always be viewed in detail as well, corresponding everyone’s own requirements of analysis.
As always, the aggregated and integrated data basis is directly accessible via a pre-built Pivot Table in Microsoft Excel, too – and thus analyzable up to the smallest detail.
…and now!?
Detailed insights into the ways that my customers cover online and the buying behavior they show in doing so are the first important step to a successful online shop – but as decisive is the second one: my business processes’ optimization based on those gained insights.
Let’s take the revenue and sales margin example we already discussed above. Quickly, it becomes clear that (my brand’s) SEM performs quite well not only regarding my revenues, but also the sales margins:

Accordingly, a higher investment in SEM could pay off to raise the revenues and achieve even higher sales margins. For SEM is ranking very well as a Last Touchpoint, too, a further possibility would consist in creating particular landingpages that lead to upselling effects in the regarding customer groups.
Optimize your marketing on the basis of a reliable analytic foundation!
Are you interested in minubo? Then maybe you'd like to take part in one of our product tour webinars:


 nach Wunsch auch mit Videocall