nach Wunsch auch mit Videocall
Commerce Reporting Standard Workshop
The Commerce Reporting Standard (CRS) is an association of qualified industry partners who seek to facilitate the entry into a data-driven decision-making culture and benchmark the industry by pooling experiences and best practices.
Regular workshops and discussions are used to promote different projects. One of the recent workshops focused on the "Onsite Customer Journey Index", developed by the project partner and technology leader in on-site marketing Akanoo. CRS community members from companies like Baumarkt direkt, REWE-Vertical ZooRoyal, the Händlerbund, mindlab and of course Akanoo, as well as the project initiators Project A and minubo, put their heads together and discussed for a whole day how the onsite behavior of the customers could be effectively mapped.
Before presenting the workshop results, here is a brief introduction to the Onsite Customer Journey Index (CJI).
Why do you need the CJI?
The topic of Customer Journey is currently ubiquitous, and every company is talking about it. Yet, for many commerce organizations, it is still very difficult to make the customer journey measurable and controllable, and thus make data-driven decisions to optimize it.
As a specialist in onsite marketing intelligence, Akanoo has recognized this challenge and attempted to define easily measurable KPIs, to make the customer journey tangible and manageable, resulting in the Onsite Customer Journey Index.
The Concept
The model developed by Akanoo is intended to allow the customer behavior in a web shop to be specifically depicted and optimized in a data-driven manner. The concept is divided into three phases based on the standard purchasing process - resulting in five KPIs, which reflect the performance of the shop in the different phases:
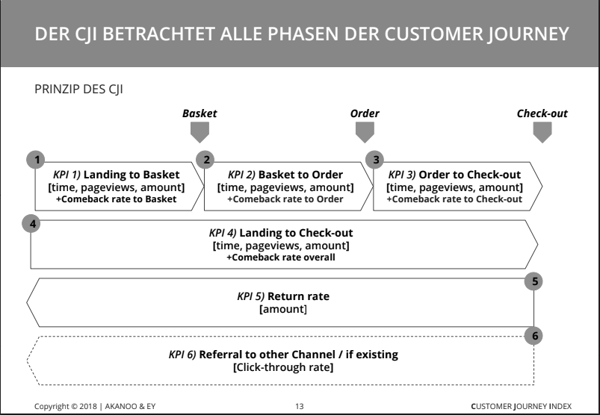
- Landing to Basket: The first KPI focuses on the period between the customer's arrival on the website and the moment he or she places something in the basket.
- Basket to Order: The second KPI focuses on the phase in which the user places something in his or her basket until the order is placed.
- Order to Checkout: The third KPI focuses on the ordering process. Specifically, on the phase from clicking on the "order button" in the basket until the completion of the order after entering all data.
- Landing to Checkout: The fourth KPI is a combination of the first three KPIs - with averages of the performance of each phase.
The calculation of these first four KPIs is based on known metrics, each describing a time window within the shop visit. However, to actually say something about the performance of a webshop, Akanoo's model design has defined sub-metrics that serve as the basis for calculating a holistic formula for each KPI. You can get a detailed insight here. - Return Rate: The fifth KPI is based on the number of users returning to the site.
For an omni-channel company, the CJI can be expanded to include a sixth KPI:
- Referral to other Channel: The sixth KPI focuses on the number of customers that the offline store refers to the online store or vice versa.
In a further step, benchmark values of the individual KPIs were developed and presented based on the consumer behavior of more than 440 million sessions in 2017. This index provides companies with a comparison value and enables the evaluation of their own webshop performance with other eCommerce companies, at every stage of the onsite customer journey.
Landing to Basket 0.12
Basket to Order 0.62
Order to Checkout 0.63
Landing to Checkout 0.08
Return Rate 0.36
Integration in Business Processes
As a rule, strategic stakeholders keep an eye on the long-term corporate goals and requirements of the industry. The Onsite CJI allows you to identify challenges in addition to the overall analysis of customer behavior and then to take necessary measures. Additionally, the company's own performance can be compared to the industry average to make strategic changes and stand out from the competition.
By contrast, the operational stakeholders are increasingly focusing on day-to-day activities and onsite customer journey monitoring. The index can help them map the different phases of customer behavior in detail, revealing specific vulnerabilities in the shop that can be addressed through targeted and efficient optimization. The success and failure of previously implemented improvements can thus be easily determined.
Outcome Workshop
Since the results of the workshop day are very extensive, only an extract of the essential findings is presented:
Rather than developing a very detailed index that relies on many data points and is thus often difficult for companies to implement, all participants agreed that the CJI will continue to convey a more general sense of performance in the future rather than demanding granularity.
One problem that was identified during the workshop is the lack of consideration of users without micro-conversion. Currently, only the values of users adding an item to the shopping cart are reflected in the first KPI. One solution might be an additional KPI 0, mapping this relevant group. This could, for example, be defined as "Landing to Leaving".
In addition, the participants agree that "Time on Site" (one of the mentioned sub-metrics for calculating individual index values) is a highly problematic measure in almost every application. This is often inaccurate and it cannot be measured for the last page visited - which makes it impossible again to determine the "time on site" for bounces. Most web tracking systems work with standardized values in this case. This allows for calculations, but it reduces the comparability between companies because not every web tracking system uses the same default values. This issue becomes even more relevant when it comes to defining KPI 0.
Another topic on the agenda was the differentiation of benchmark values according to different characteristics in order to make them even more specific. Because user behavior can vary widely between different industries, the index should enable companies to compare with other companies in the same industry and business model in the future. The differentiation of the customer type (for example, new and existing customers, customers interested in different product lines, etc.) is also relevant and another way to maximize the shopping experience in the shop for customers with significantly different types of behavior.
Additional measured values, optimized variables, feature differentiation - these are just a few examples of the discussion topics, ideas and suggestions from the workshop participants. A detailed insight and a detailed description of all results can be found here.
Do you want to join in discussions and learn more about industry-relevant topics such as the Onsite Customer Journey Index? To stay up-to-date with the progress of the project, sign up for our newsletter.

For a personal exchange on the project, please contact co-initiator Anne-Katrin Golombek directly at anne@commerce-reporting.com.